🛞
Prioritize upgrades
Spend $$$$ on Lighter wheels, or $ on faster-rolling tires? Before you spend either, find out which one your trails actually reward.
 MTBX
MTBX
MTB Hangtime · Tutorial
Every rider I know has stood in a shop doing this math in their head: would lighter wheels actually make me faster, or do I just want them? Forksight answers that with your own riding. It takes a ride you've already recorded, lets you make a change (weight, power, or tires), and re-rides the whole route to show you what that change would have done to the clock.
At heart, it's a what-if calculator built on a ride you've already done. Pick a recorded ride, then change one of three things: your total weight, your power, or your tires. Hangtime replays the exact route with that change applied and tells you how much time it would have saved or cost. Not on some generic test course, but on your trail, the way you actually rode it that day.
Honest answer: the New column is an estimate. It comes from the same physics model the rest of the app uses to turn speed and slope into power, just run in reverse: take a changed power, solve for the new speed. So read the Total Time Change as well-proven physics, not a stopwatch guarantee.
Where it works well is comparison: which change is the bigger win? Is more power worth more than faster tires on your loop? Is three pounds even worth chasing? Those questions it answers very well, because both scenarios run through the same model on the same ride.
And if you rode with a power meter, you get a built-in reality check: the Power Meter column shows your real measured watts right next to the model's estimate. If the two are miles apart, something in your setup is probably off. Check your rider weight and tire settings first.
At every instant of your recorded ride, physics ties together your speed, the slope under you, the air you were pushing through, and the drag of your tires. From the speed and slope your phone recorded, Hangtime works backwards to the power each moment must have taken. That gives it a complete, second-by-second picture of the ride, not just an average.
Then it applies your change. Add ten percent power, shave three pounds, or drop your rolling resistance, and it solves the same physics in the other direction to get a new speed at every instant. Add all those moments back up, compare against the original, and the gap is your Total Time Change.
Spend $$$$ on Lighter wheels, or $ on faster-rolling tires? Before you spend either, find out which one your trails actually reward.
Put a number on the winter. If the climb needs to be four minutes faster, Forksight tells you how many watts that actually is, a target you can train toward.
The full bladder, the just-in-case tools, the second bottle. Weight is weight, whether it's on the bike or on your back, and now you can see what each pound costs on your loop.
How far off the top ten are you, really? And is the gap a tire problem, a weight problem, or a legs problem? Forksight lets you test each theory against your own race run.
Changing one input keeps things easier to interpret: move a single control, note the Total Time Change, then set it back to zero before you try the next. Nothing stops you from changing weight and power together (the page will happily show the combined result), but you'll never know how much came from which. One lever at a time tells you what each change is really worth on its own.
Power earns its time on the climbs and flats, where you're actually driving watts into the pedals. On a coasting descent there's hardly any power to add, so those sections barely move. Weight cuts both ways: lighter is faster uphill, but a heavier rider coasts downhill faster. That's why, on a big climbing day like the example below, nearly all of the difference lands on the climb, which is a reassuring sign the model is behaving like real physics and not applying some flat fudge factor.
Open your list of recorded rides, pick the one you're curious about, and tap the Forksight button on the Health tab.
The table looks dense at first, but it's pretty simple. Every row compares up to four columns, left to right:
On a ride without a power meter the first column drops away and the headers read Existing, New, Change.
The ride itself is split into three blocks, Climb, Flat, and Descent, each showing Power (Watts), Avg Speed, and Time. This is the part I find most useful: it shows you where a change pays off, not just the total. Above the blocks, Total Weight (lbs) Rider + Bike, Avg Watts, and Coefficient Rolling Resistance summarize what went into the calculation.
One thing to expect: Est. and Power Meter won't match exactly, and that's fine. Est. is the model's estimate from your speed and slope; Power Meter is what your device actually logged. The New scenario is always built from the Est. baseline. The Power Meter column sits alongside purely as a reality check that the model is in the right ballpark.
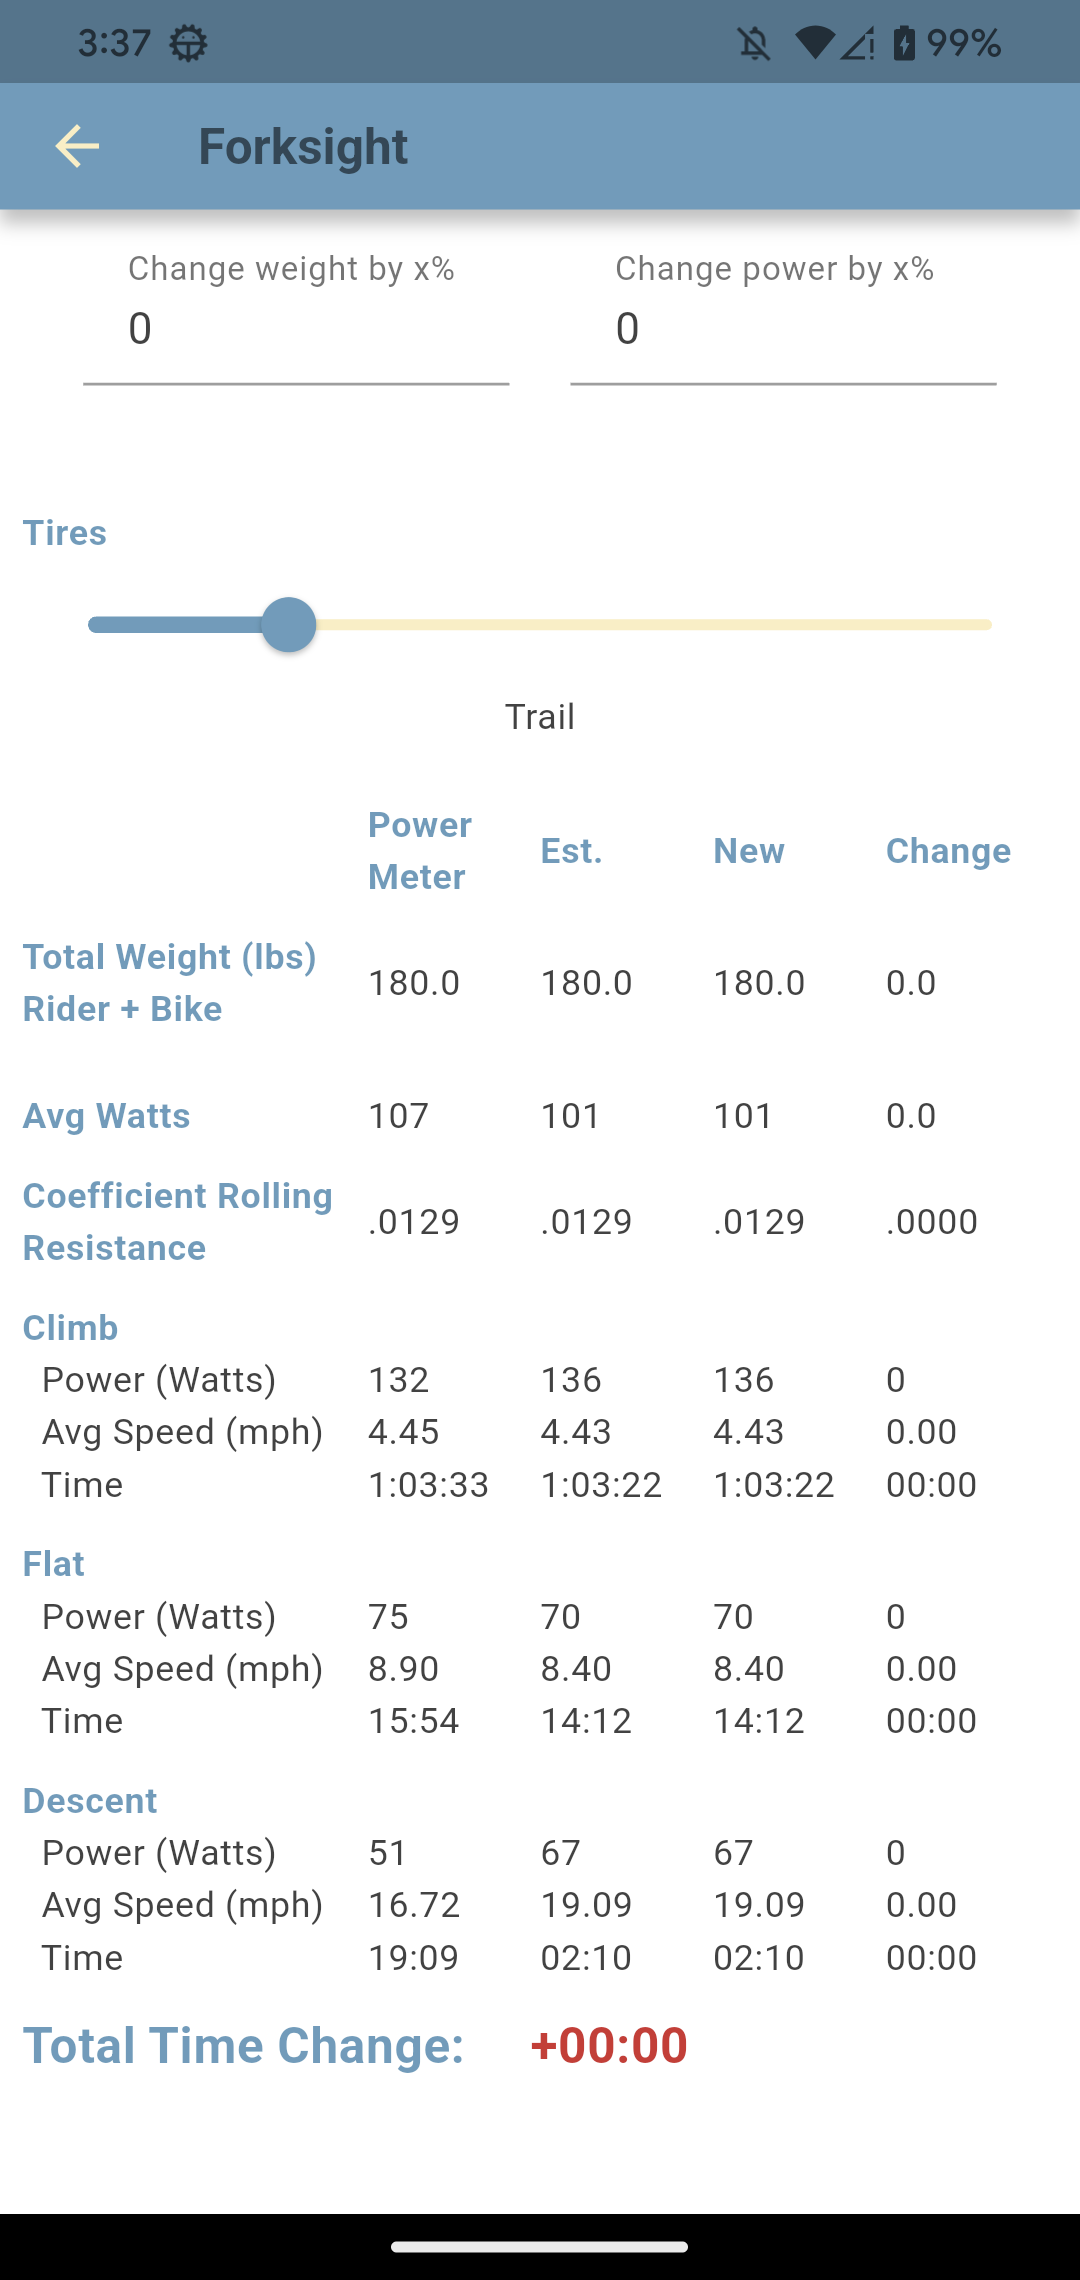
Here's one real recorded ride, a long sustained climb on Trail tires (Crr .0129, 180 lb of rider plus bike), put through four different what-ifs. Keep an eye on the Total Time Change at the bottom of each screenshot.
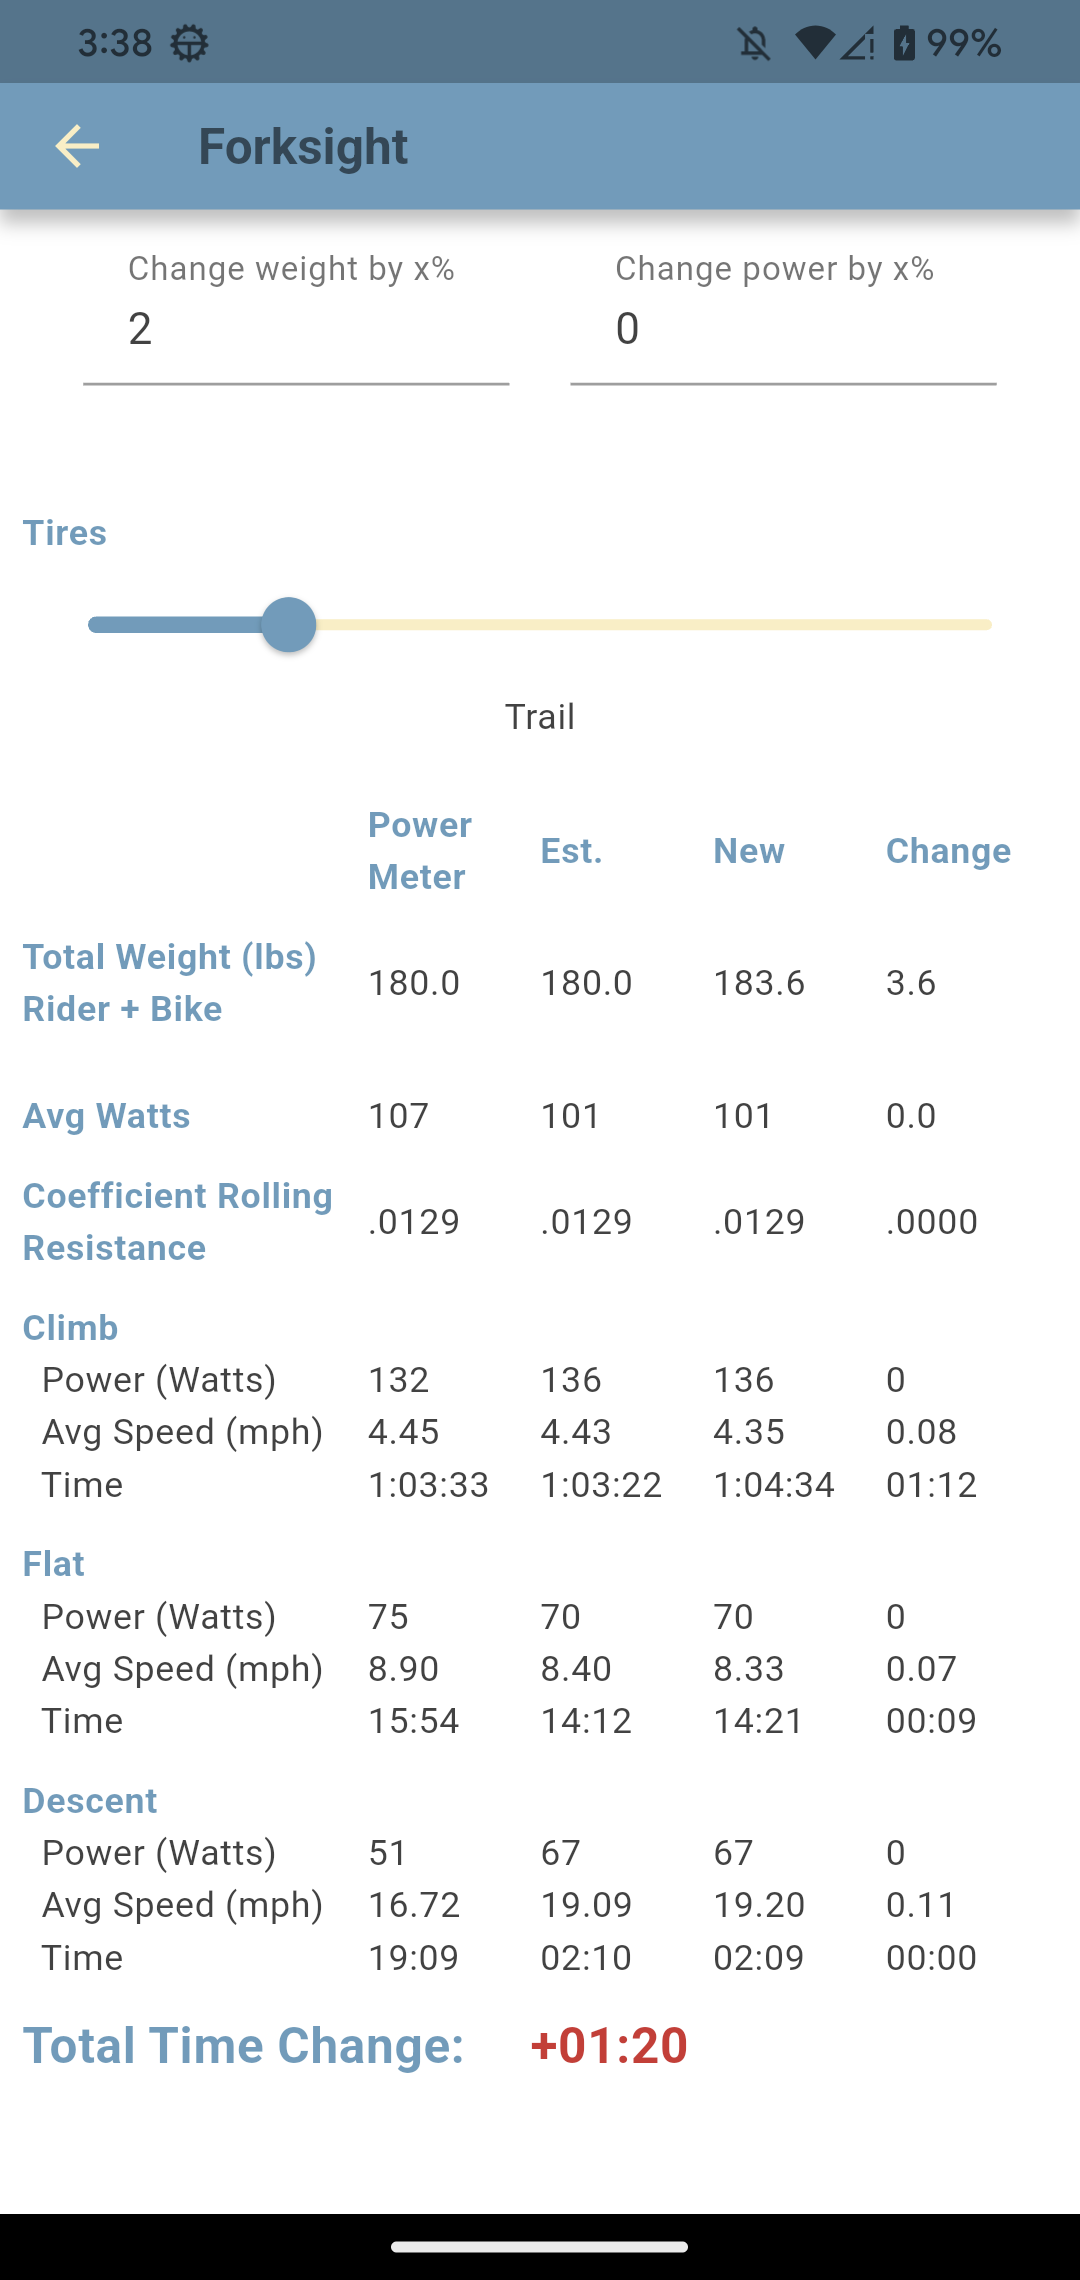
A full water bladder?
Type 2 into Change weight by x%, about 3.6 pounds on this setup (roughly a full hydration bladder), and the ride comes out 1 minute 20 seconds slower.
Almost all of that is the climb, which stretches from 1:03:22 to 1:04:34, with the flat adding another 9 seconds. The descent actually gets slightly faster (19.09 → 19.20 mph) because a heavier rider coasts downhill quicker, but on a two-minute descent that's worth less than a second.
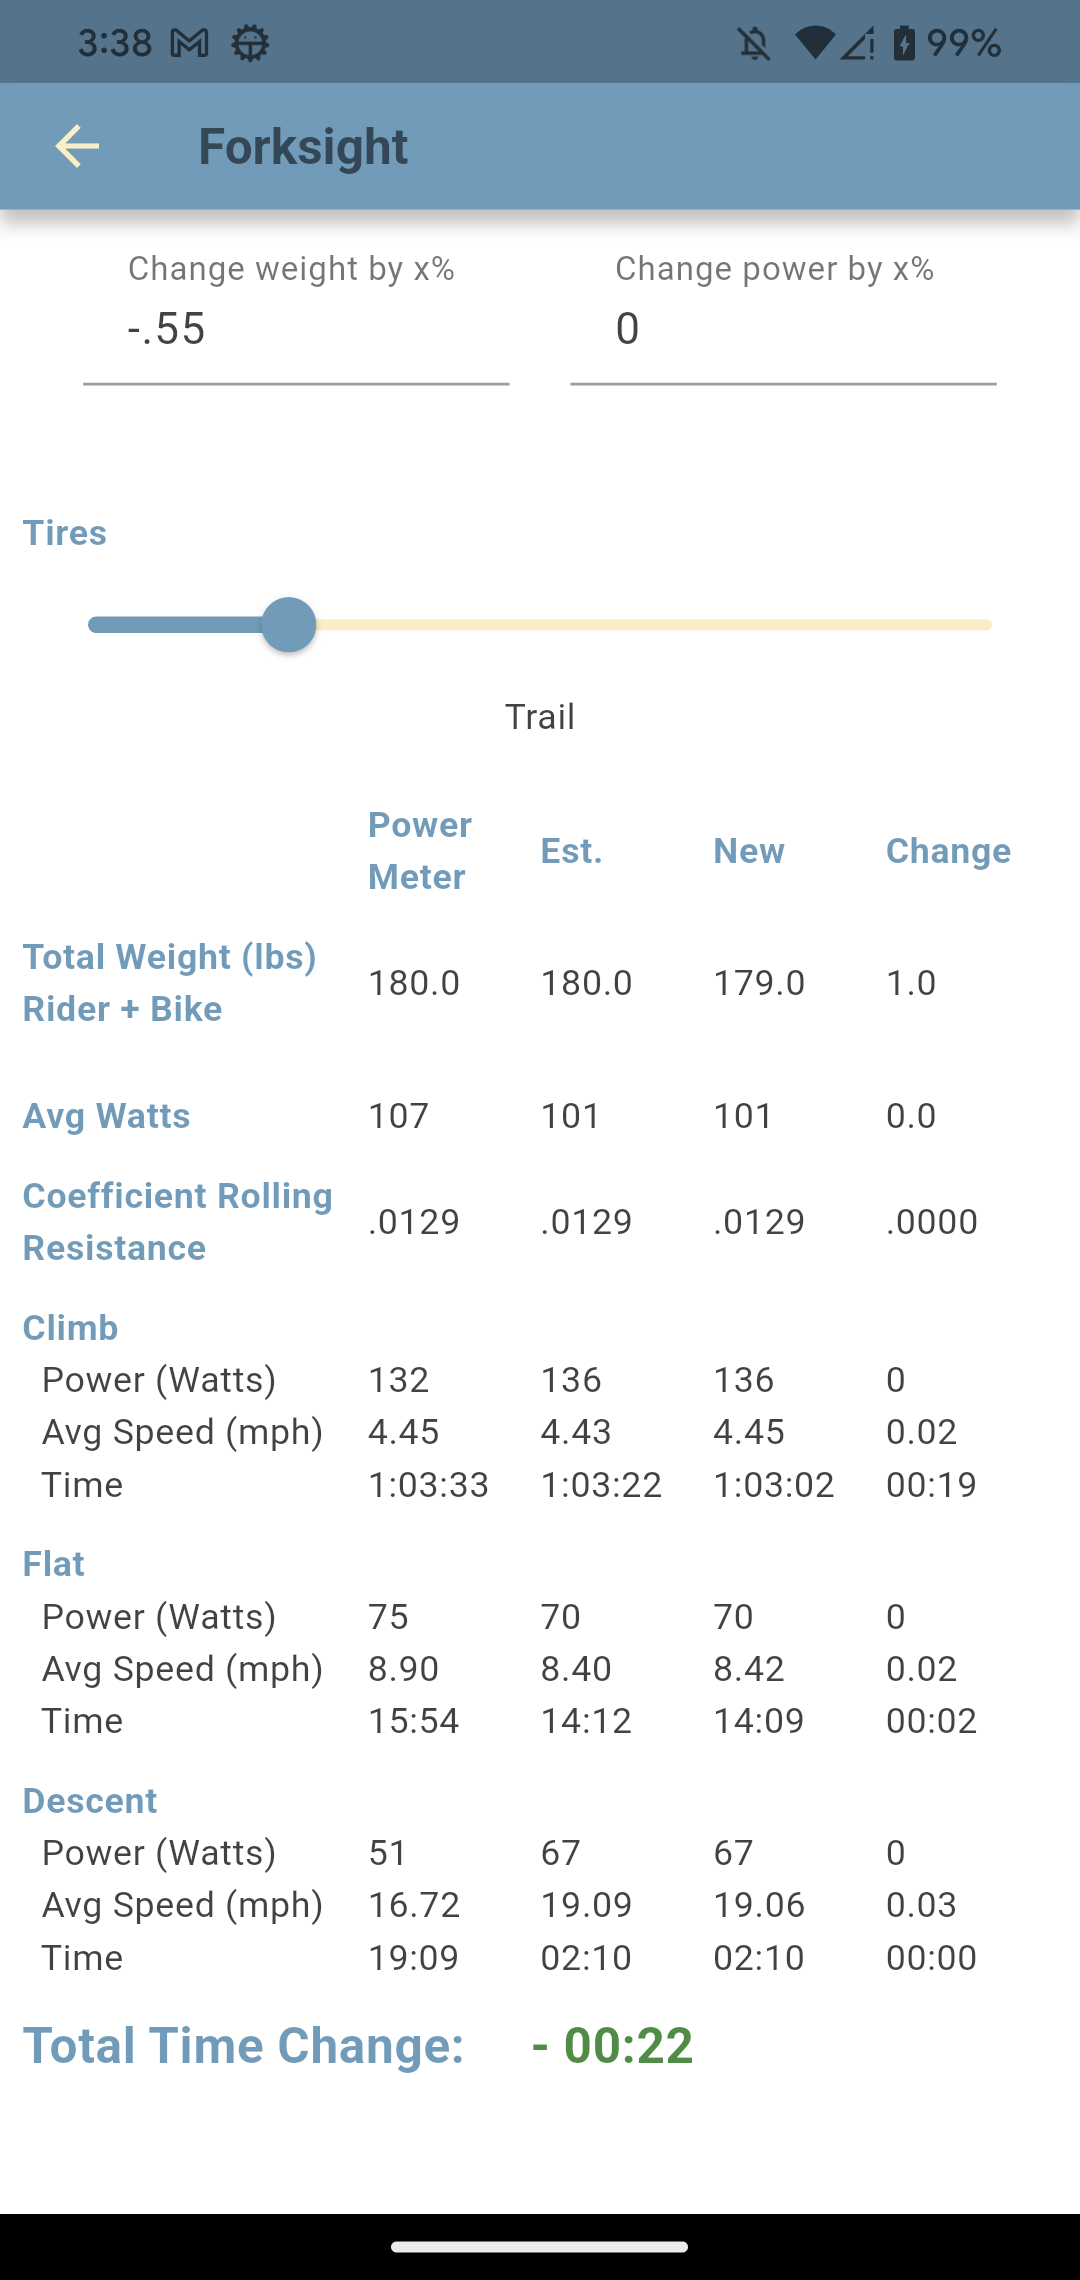
A lighter wheelset?
Now go the other way. Type −.55 to shave a single pound, down to 179 lb, about what an upgrade to a lighter wheelset buys you. You get 22 seconds back.
Notice that's about 22 seconds per pound, almost exactly the rate the full bladder charged in the other direction (80 seconds for 3.6 pounds).
Stronger Legs?
Here's where it gets humbling. Type 10 into Change power by x%, the kind of gain a focused winter of training can produce. Average watts rise from 101 to 111, and the ride drops by 6 minutes 28 seconds. That dwarfs everything the wallet can buy.
Almost all of it comes off the climb (−5:32), with the flat (−0:54) chipping in the rest. The descent gives up just 2 seconds, because there's very little power to add while you're coasting. On a climb this long, your legs are overwhelmingly the strongest lever you have.

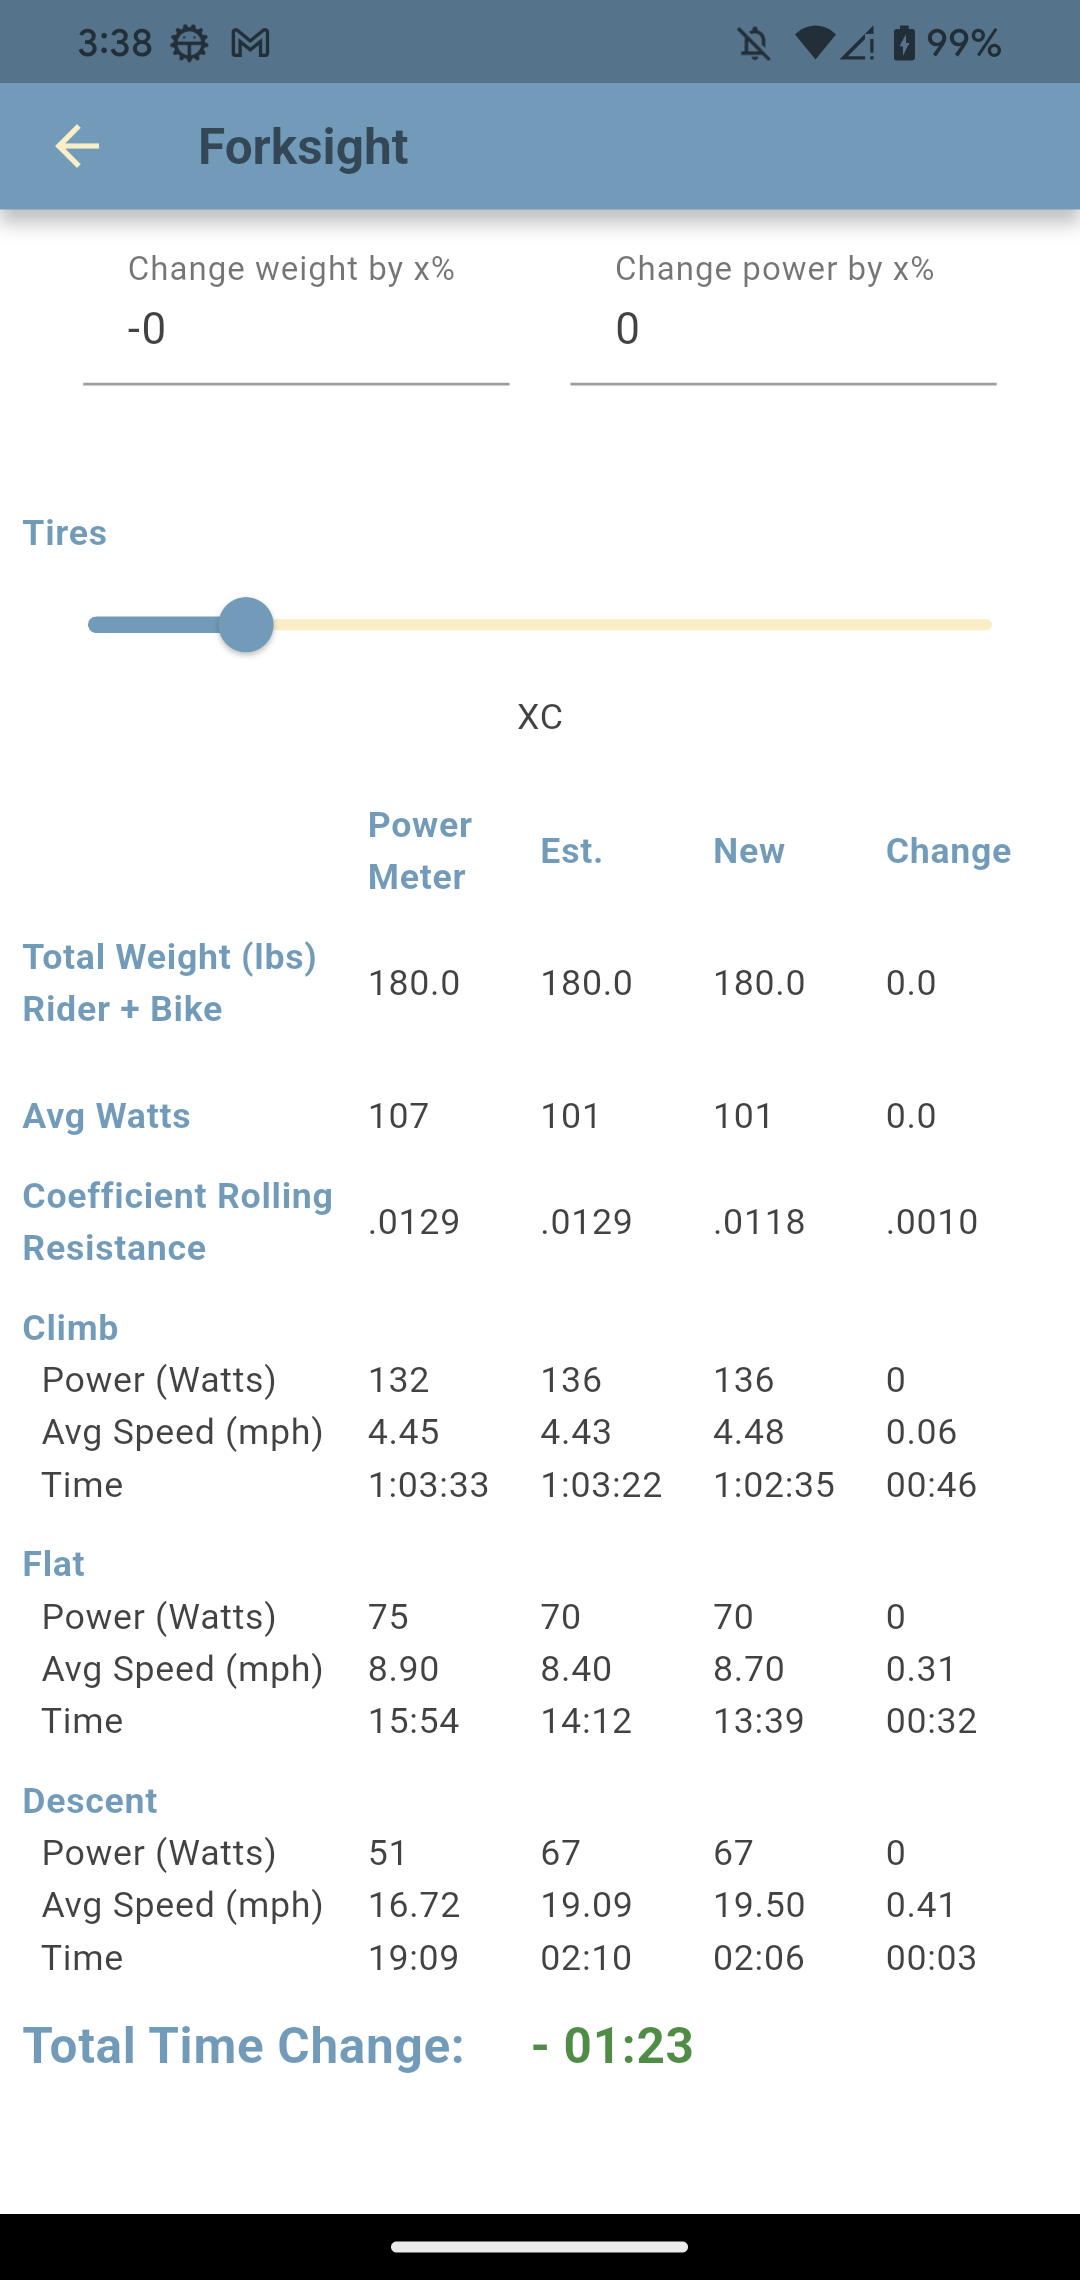
Switch to a faster tire
Finally, the cheapest experiment of the four. Drag the Tires slider from Trail to XC, trading some grip for a faster-rolling race tire, and the Coefficient Rolling Resistance falls from .0129 to .0118. The ride comes back 1 minute 23 seconds quicker.
Rolling resistance works against you everywhere the wheels are turning, so unlike a power change the savings spread across the whole ride: climb −0:46, flat −0:32, descent −0:03. Whether you'd actually want less grip on your trails is a different question, but at least now you know what the grip is costing.
Not sure of your tires' actual Crr? Hangtime's Chung Method page shows how to measure it from your own rides, so the number you test here matches your real setup.
There are only three of them (four if you count hiking), and they all live at the top of the page, just above the table.
A percentage you type in, positive or negative. It scales the whole system (rider plus bike), so 2 on a 180 lb setup adds about 3.6 lb, and a negative number takes it off. Starts at 0, meaning the ride exactly as you rode it.
Same idea, applied to the power the model worked out for your ride. 10 asks what a ten-percent-fitter you would have done on the same day; a negative number models tired legs. Also starts at 0.
A slider that sets rolling resistance by tire type, from Gravel (fastest) through XC, Trail, and Enduro to Downhill (slowest). It starts on whatever tire the ride was recorded with, and you can watch the value it sets in the Coefficient Rolling Resistance row as you drag. If the preset categories leave you guessing, the Chung Method page explains how to estimate the actual Crr of your tires.
One more, for when you leave the bike at home. On hikes the page swaps the tire and weight controls for a single New Pack Weight slider, set as a percentage of your body weight. Handy for seeing what a lighter pack would have done to a long day on foot.
It's the cheapest and fastest experiment in mountain biking: every upgrade gets tested before a dollar leaves your pocket. Head back to MTB Hangtime for the rest of the app, or grab it here: