The Chung Method: Are my new tires actually faster?
Hangtime's Chung page reads a ride recorded with a power meter and estimates two numbers most riders never get to see: rolling resistance (Crr) and aerodynamic drag (CdA). And no, you don't need to hold a constant power output while you ride.
What is the Chung method?
The Chung method, also called the virtual elevation method (developed by Dr. Robert Chung), is a clever way to estimate your drag and rolling resistance from data you already record. During every instant of a ride, physics ties together your power, your speed, the slope you're on, the air you're pushing through, and the friction of your tires. If you know all of those except the slope, you can solve for the slope, and adding the slopes up over the ride gives a calculated elevation profile.
Hangtime calls that calculated profile your virtual elevation (the orange line). It depends on the two unknowns: Crr and CdA. Set them wrong and the virtual elevation drifts away from the elevation you actually rode (the green line). Set them so the lines lie on top of each other, and you've found the Crr/CdA pair that explains this ride.
The whole technique in one sentence: Slide Crr and CdA until the orange virtual elevation line matches the green recorded (or known) elevation line. The slider values that produce the match are your estimate for that run.
Are the Crr and CdA estimates correct?
The absolute value you land on is only a baseline. It leans on your best estimates for mass, drivetrain loss, and air density. But don't worry too much about getting these exactly right, because even rough estimates still produce surprisingly accurate results when you compare a new set of tires or a new aero helmet.
The power of the method is in the difference between two runs. Hold everything else constant (with the exception of power) and change one variable; the shift in the fitted number is the effect of that change.
For example, drop your tire pressure and the Crr that closes the gap between the actual and the virtual elevation profiles is the rolling-resistance change.
Swap a trail helmet for an aero helmet and the CdA value that closes the gap between the virtual and actual elevation is the CdA gain. You're measuring changes in CdA and Crr, not chasing a perfect absolute.
It is important to note that power does not need to remain constant during or between tests. The power meter records power with very high accuracy, so any variations in power are accounted for in the math behind the virtual elevation profile. It might sound crazy, but it works amazingly well.
When & why to use it on your ride
The method needs power data (a paired Bluetooth power meter), but unlike other methods, you don't even need to try to keep your power constant. You can read more about the Chung method if you want to learn why. While constant power is not required, wind will be your biggest enemy, so pick a day with little to no wind for your test. And there is one rule you can never bend: keep off the brakes for the entire test (we explain why just below). You'll have two options when planning your route:
🔁
Option A (Closed Loop)
Laps that finish exactly where they started. You know the net elevation change is zero, so you don't even need accurate recorded elevation; you tune against a flat reference of 0 m. This is the Known mode below, and it's the cleanest way to pull out Crr and CdA.
⛰️
Option B (Recorded Elevation)
A point-to-point track where the recorded barometer/terrain elevation is solid. You tune the virtual line to overlay your Recorded elevation across the test section of trail.
One hard rule: never touch the brakes
This is the one requirement you cannot bend. From the moment the test section starts until it ends, keep your hands off the brakes. Not a tap, not a feather, not into a corner.
Here is why it matters so much. The method works by balancing every force acting on you: gravity, rolling resistance, drag, and the power you put in. Your power meter captures every watt you add, which is exactly why your effort is allowed to vary. But a watt you scrub off with the brakes is invisible to the app. That energy does not leave the math, it gets blamed on drag and rolling resistance instead, quietly inflating your CdA and Crr and corrupting the fit.
So plan a route you can ride from start to finish without ever needing to slow down: no stop signs or junctions, no tight corners that force a brake check, nothing so steep or loose that you could not ride it safely off the brakes. If you do touch them, the run is no longer valid. Throw it out and ride a clean one.
Running a clean back-to-back test
Treat it like a controlled experiment. The goal is for the only thing that changed between runs to be the variable you're testing:
Same loop, same day, similar weather and wind, back-to-back.
No braking on either run (pedaling is fine, braking is not). One tap and that run is out.
Change exactly one thing (pressure, tire, helmet, body position) between runs.
Fit each run the same way (same comparison mode, trim, sources, air-density inputs).
Compare the fitted values. The difference is the effect of your change; the absolute numbers are just the baseline you measured it from.
Opening the Chung page
Open one of your recorded rides, then tap the ? Chung button on the ride's Health Tab. This button will only be available for activities recorded with a power meter.
Reading the graph
The chart plots elevation (meters) up the side against distance or time along the bottom. Two lines matter:
Virtual Elevation (orange): the profile your power & speed imply, given the current Crr and CdA.
Recorded / Known Elevation (green): what actually happened (recorded elevation).
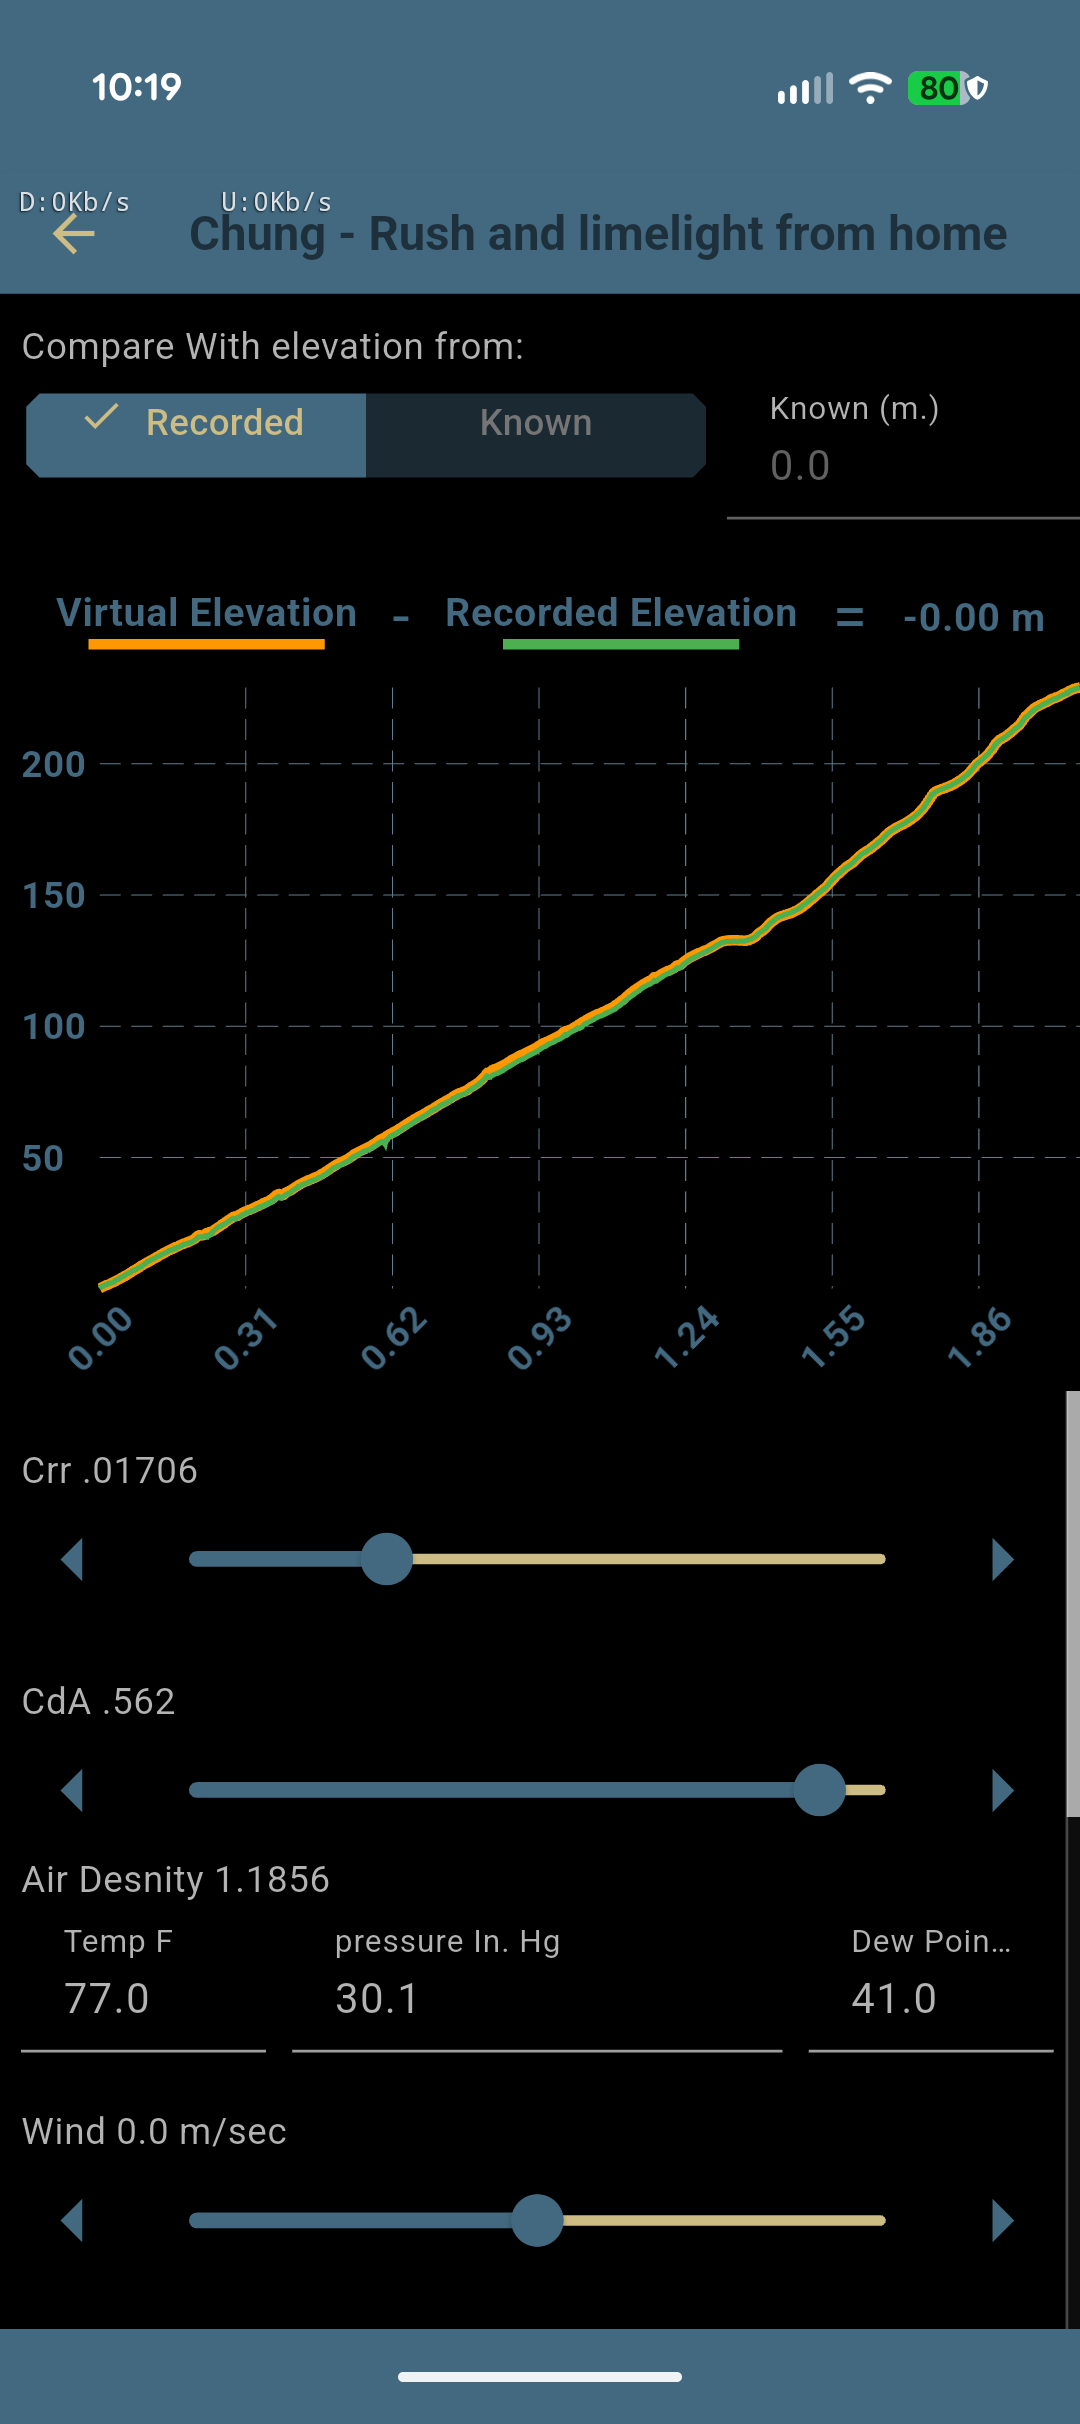
The readout above the chart is the difference between Virtual and Recorded Elevation: Virtual Elevation − Recorded Elevation = ? m. Your goal is to drive that number to 0.00 m using the Crr and CdA sliders, at which point the lines overlap.
A working example
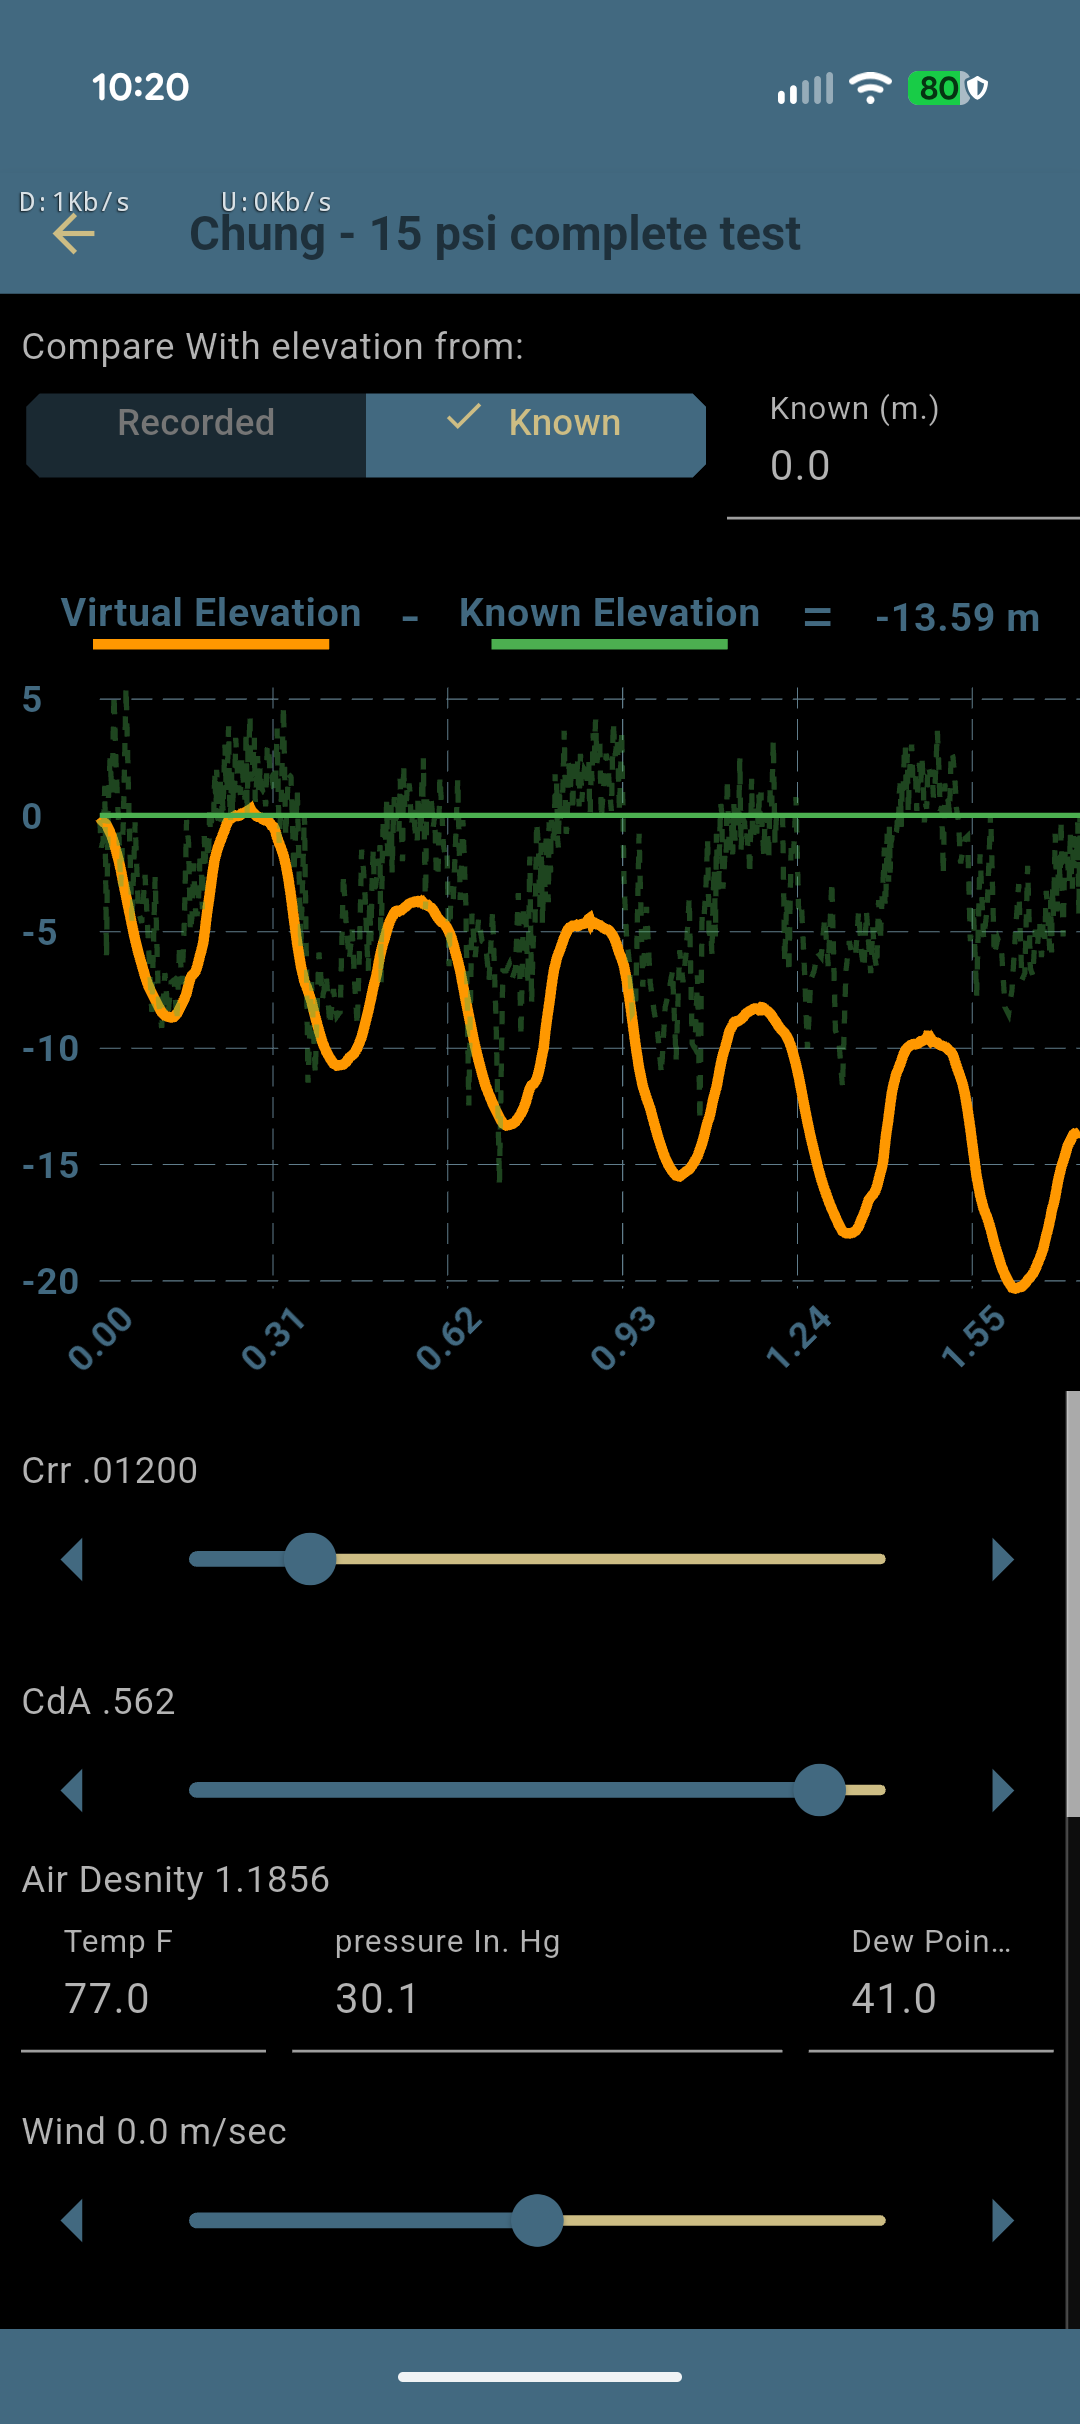
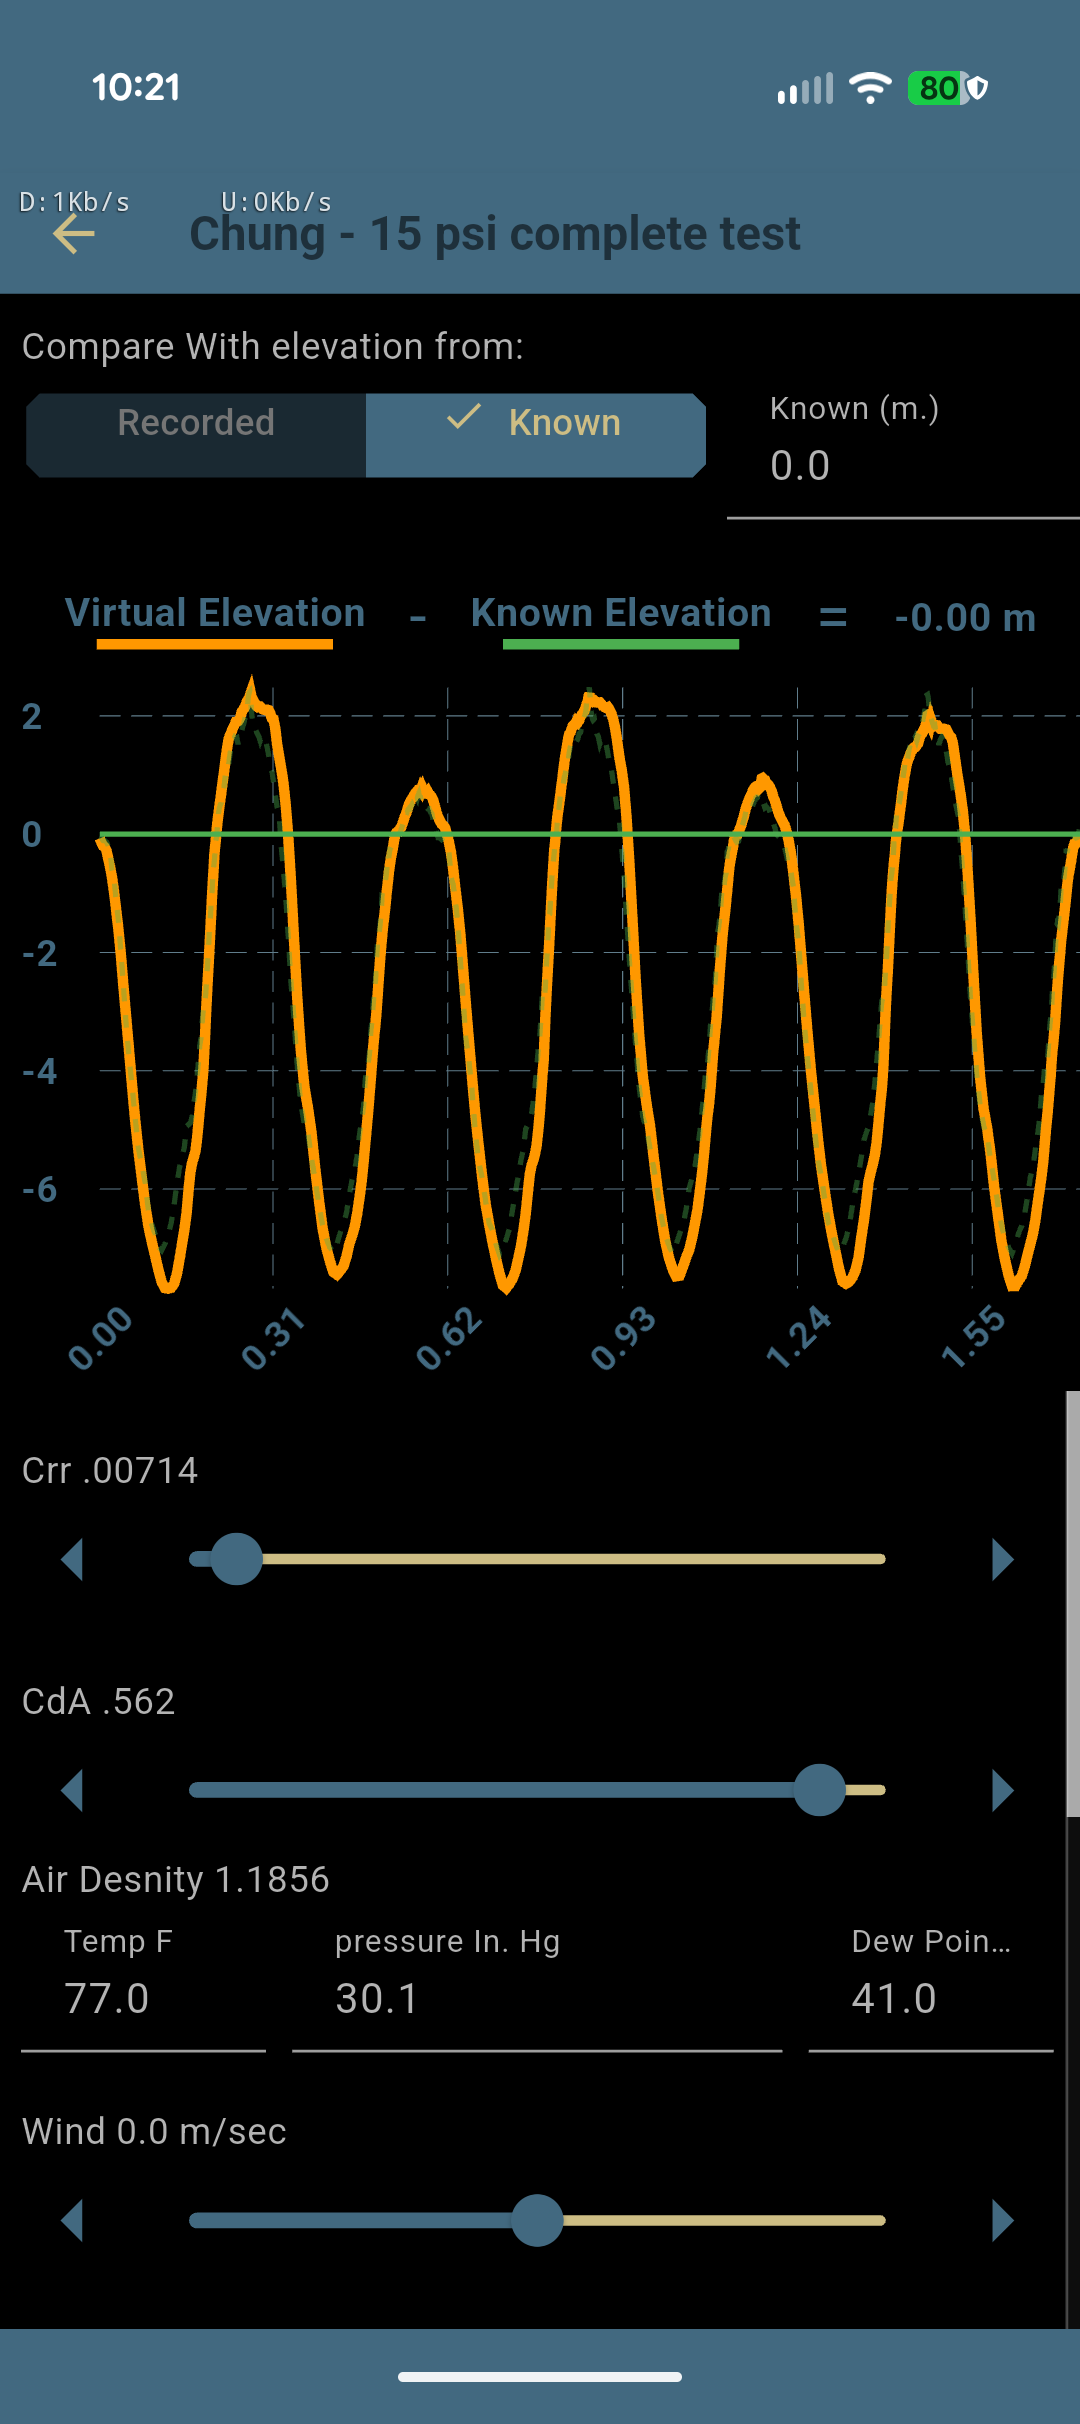
Option A · Known (closed loop)
Drag Crr until the laps net to zero
For repeat laps that return to the exact same spot, the true net elevation change is zero. Switch to Known and leave
Known (m.) at 0.0. The green line becomes a flat reference at zero. Each lap of the orange virtual line should rise and fall and come back to that flat line at the end of the last lap.
With Crr too high, the laps drift below zero (here the readout started around −13.59 m). Drag Crr until the last lap returns to the flat line and the readout reads ≈ 0.00 m. That's your baseline Crr for this surface and pressure. In this "15 psi" test it came out at .00714. Run the same loop at a different tire pressure, and comparing the two fitted Crr values shows exactly what that pressure change did.
Now Increase the Tire Pressure
How does additional pressure affect Crr?
Now ride the exact same loop with the tires pumped up to 25 psi and fit the two elevation profiles the same way. The net elevation change is close to zero again, but at a different Crr.
Higher Crr means more rolling resistance, so on this surface the harder tire actually rolled slower. That might sound counterintuitive at first, but it's expected, and it shows up in most off-road tire-pressure testing.
Option B · Recorded
Drag Crr until the lines overlap
Keep Compare With elevation from: on Recorded.
Use Trim to cut off any noisy start or end, or to isolate a section of trail.
Optionally switch Elevation Source to Terrain for a cleaner target.
Drag Crr until the orange line settles onto the green one and the readout reaches ≈ 0.00 m. Remember: if orange sits above green, raise Crr; if it's below, lower it.
Read the Crr off the slider. That's this setup's baseline. In the example it landed at .01706. Re-run after changing your tire pressure, and the difference between these two Crr values can be attributed to the tire pressure change.
Tip: try Terrain to smooth noisy elevation
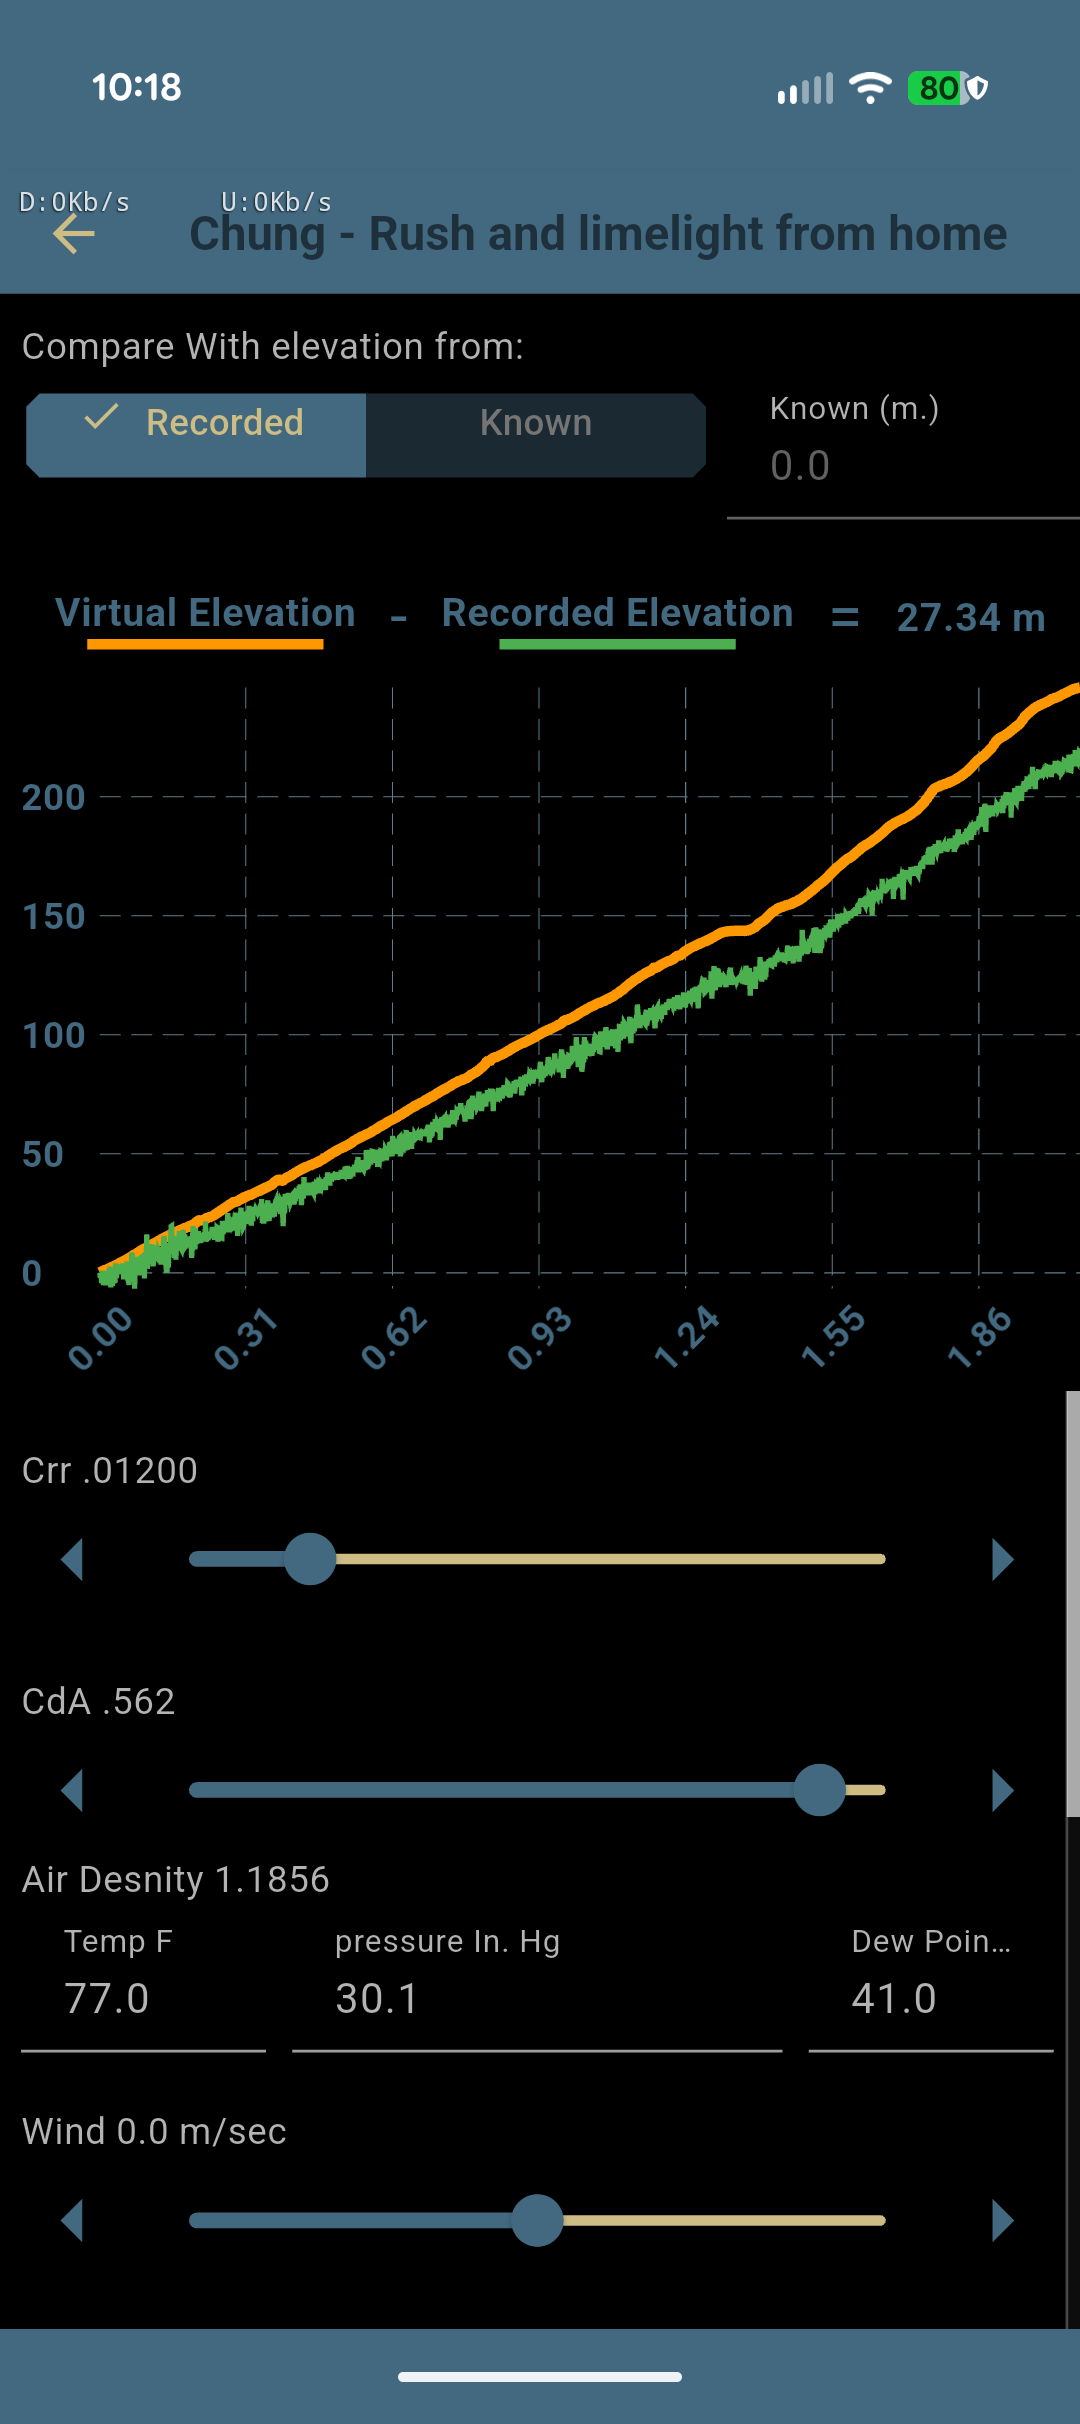
Barometric elevation can be jagged: gusts, pressure swings, and sensor noise all show up as fuzz on the green line, which makes it hard to judge a match. Switching Elevation Source to Terrain rebuilds the reference from the 3D map's terrain data, smoothing out that jaggedness so the comparison is much easier to read.
In the example, switching to Terrain cleaned up the green line and tightened the gap from 27 m down to about 17 m before any tuning. Note that the orange line is estimated entirely from the rider's speed, power, weight, and so on, yet its profile almost perfectly mirrors the green line (the actual elevation).
Other Settings
All the controls live in one scrolling list under the graph. Here's the top of that list (left), with the rest below.
Compare With elevation from:
A toggle between Recorded (compare against the elevation your ride actually logged) and Known (compare against a number you type into Known (m.), e.g. 0 for a loop that returns to its start).
Crr
Rolling-resistance coefficient: the friction of your tires on the surface. This is one of the two primary estimates you'll tune.
The label shows the current value (e.g. Crr .01200); drag the slider, or tap the ◀ ▶ arrows for fine steps. Higher Crr lowers the virtual line; lower Crr raises it.
CdA
Drag area (coefficient of drag × frontal area, in m²): how much air you push. This is the second primary estimate you'll tune. Tune it the same way as Crr; it mostly affects the faster sections of the ride.
Air Density
The air density used for the drag calculation (shown in kg/m³). You don't set it directly. It's computed from the three fields beside it: Temp F (temperature, °F),
pressure In. Hg (barometric pressure, inches of mercury) and Dew Point F (°F). Enter the conditions at the time of the ride for the most accurate CdA. They can usually be found in most weather apps.
Wind
A steady head- or tailwind in m/s. (Headwind) for positive, (Tailwind) for negative, and nothing at Wind 0.0 m/sec. Leave it at zero unless you know the wind and rode a consistent direction.
Drive Train loss %
How much power is lost in the chain and drivetrain before it reaches the ground (e.g. Drive Train loss % 2.0). A couple of percent is typical.
Trim
A range slider that chops off the noisy start and end of the recording so you only analyze the steady part. The labels show how much is trimmed from each end in seconds; drag the two handles, or use the ◀ ▶ arrows for one-second nudges.
Speed Source
Choose GPS Speed or Speed Sensor. A wheel-based Bluetooth speed sensor is usually smoother and more accurate than GPS, but GPS works fine too; the Speed Sensor option is only available if the ride recorded one.
Elevation Source
Choose the data source for the recorded elevation (green line): Barometer (the elevation your phone recorded) or Terrain (sampled from the 3D map). See the Terrain tip above for why it often helps.
X Axis
Plot the chart against Distance or Time.
That's the Chung page.
Record a loop with power, trim it, drag Crr to a flat match, then change one thing and do it again. The gap between the two runs is real data that defines the effect of your change. Back to MTB Hangtime, or grab the app: