 MTBX
MTBX
MTBX
MTBX
MTB ShockTune
Use your phone's accelerometer to capture, graph, and analyze acceleration data in real time. Record multiple settings scenarios — spring, compression, rebound — then compare them to see which actually works best on your bike.
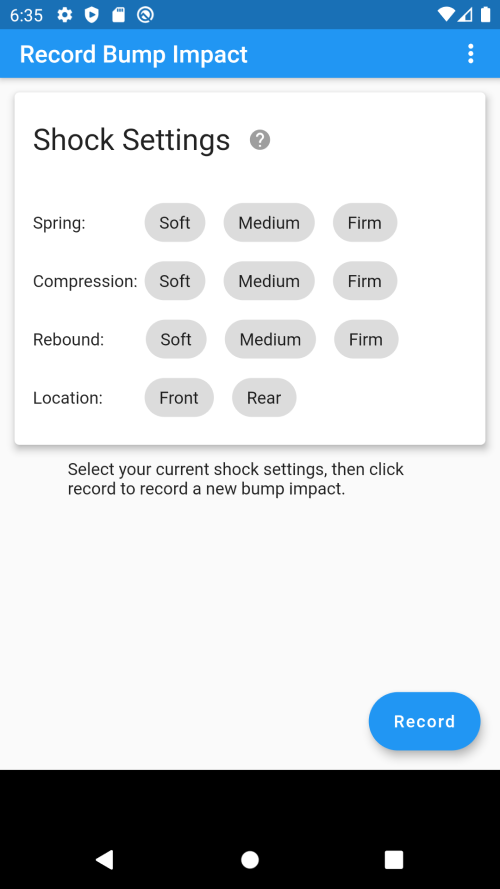
Mount the phone securely to the frame of the bike, handlebars, or stem — but not on any moving suspension parts. If you're targeting the front shock, mount it over the front (handlebars). If you're targeting the rear shock, mount it toward the rear (seat post).
The phone doesn't need a particular orientation. It can be on the top tube angled toward the rider, or perfectly horizontal facing up.
Each recording is tagged with the shock's current configuration, so you can compare apples to apples later.
Spring — the closest current setting for the shock you're recording. For air shocks, think PSI; for coils, spring rate or pre-load.
Compression & Rebound — the closest current settings. If your shock has high- and low-speed adjustments, pick one or the other. Changing multiple settings at once makes it hard to know which one moved the needle.
Location — front or rear. Make sure your phone mounting matches.
Tap the record button to start. The phone will use its accelerometer to capture force in all directions, so try to minimize unnecessary jostling — anything you do to the bike shows up in the data.
Roll toward your test bump at a consistent, repeatable speed. A small ramp into a bump works great because it isolates suspension behavior from rider input (pedal bob, lean, etc).
After the impact, come to a controlled stop and tap stop. You'll see the X / Y / Z acceleration plotted in real time. One big peak around the bump impact, with leading and trailing forces. If the trace is dominated by noise, discard and re-run.
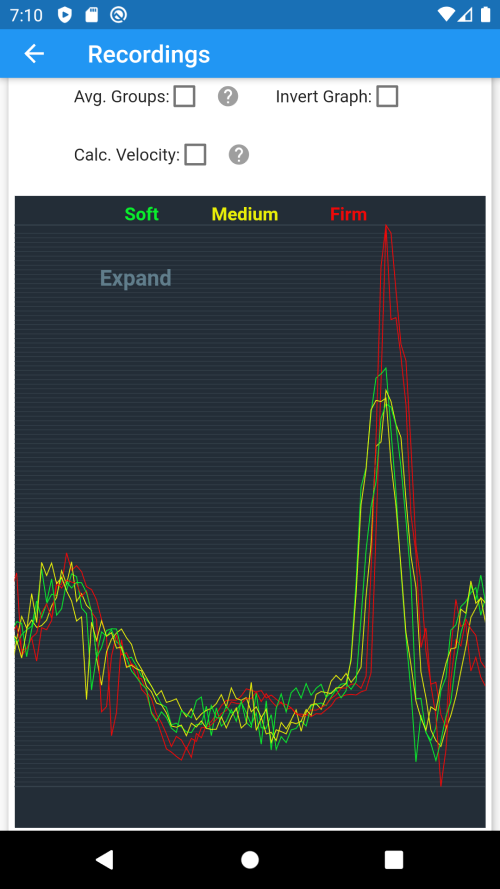
Select multiple recordings to graph them on the same axes. Each curve is centered on its peak so the impacts line up — making it easy to see how rebound, compression, or spring rate changes the curve.
When one setting varies and the others are held constant, the lines color by setting value. With enough recordings you'll see clear clustering — that's your data telling you what works.
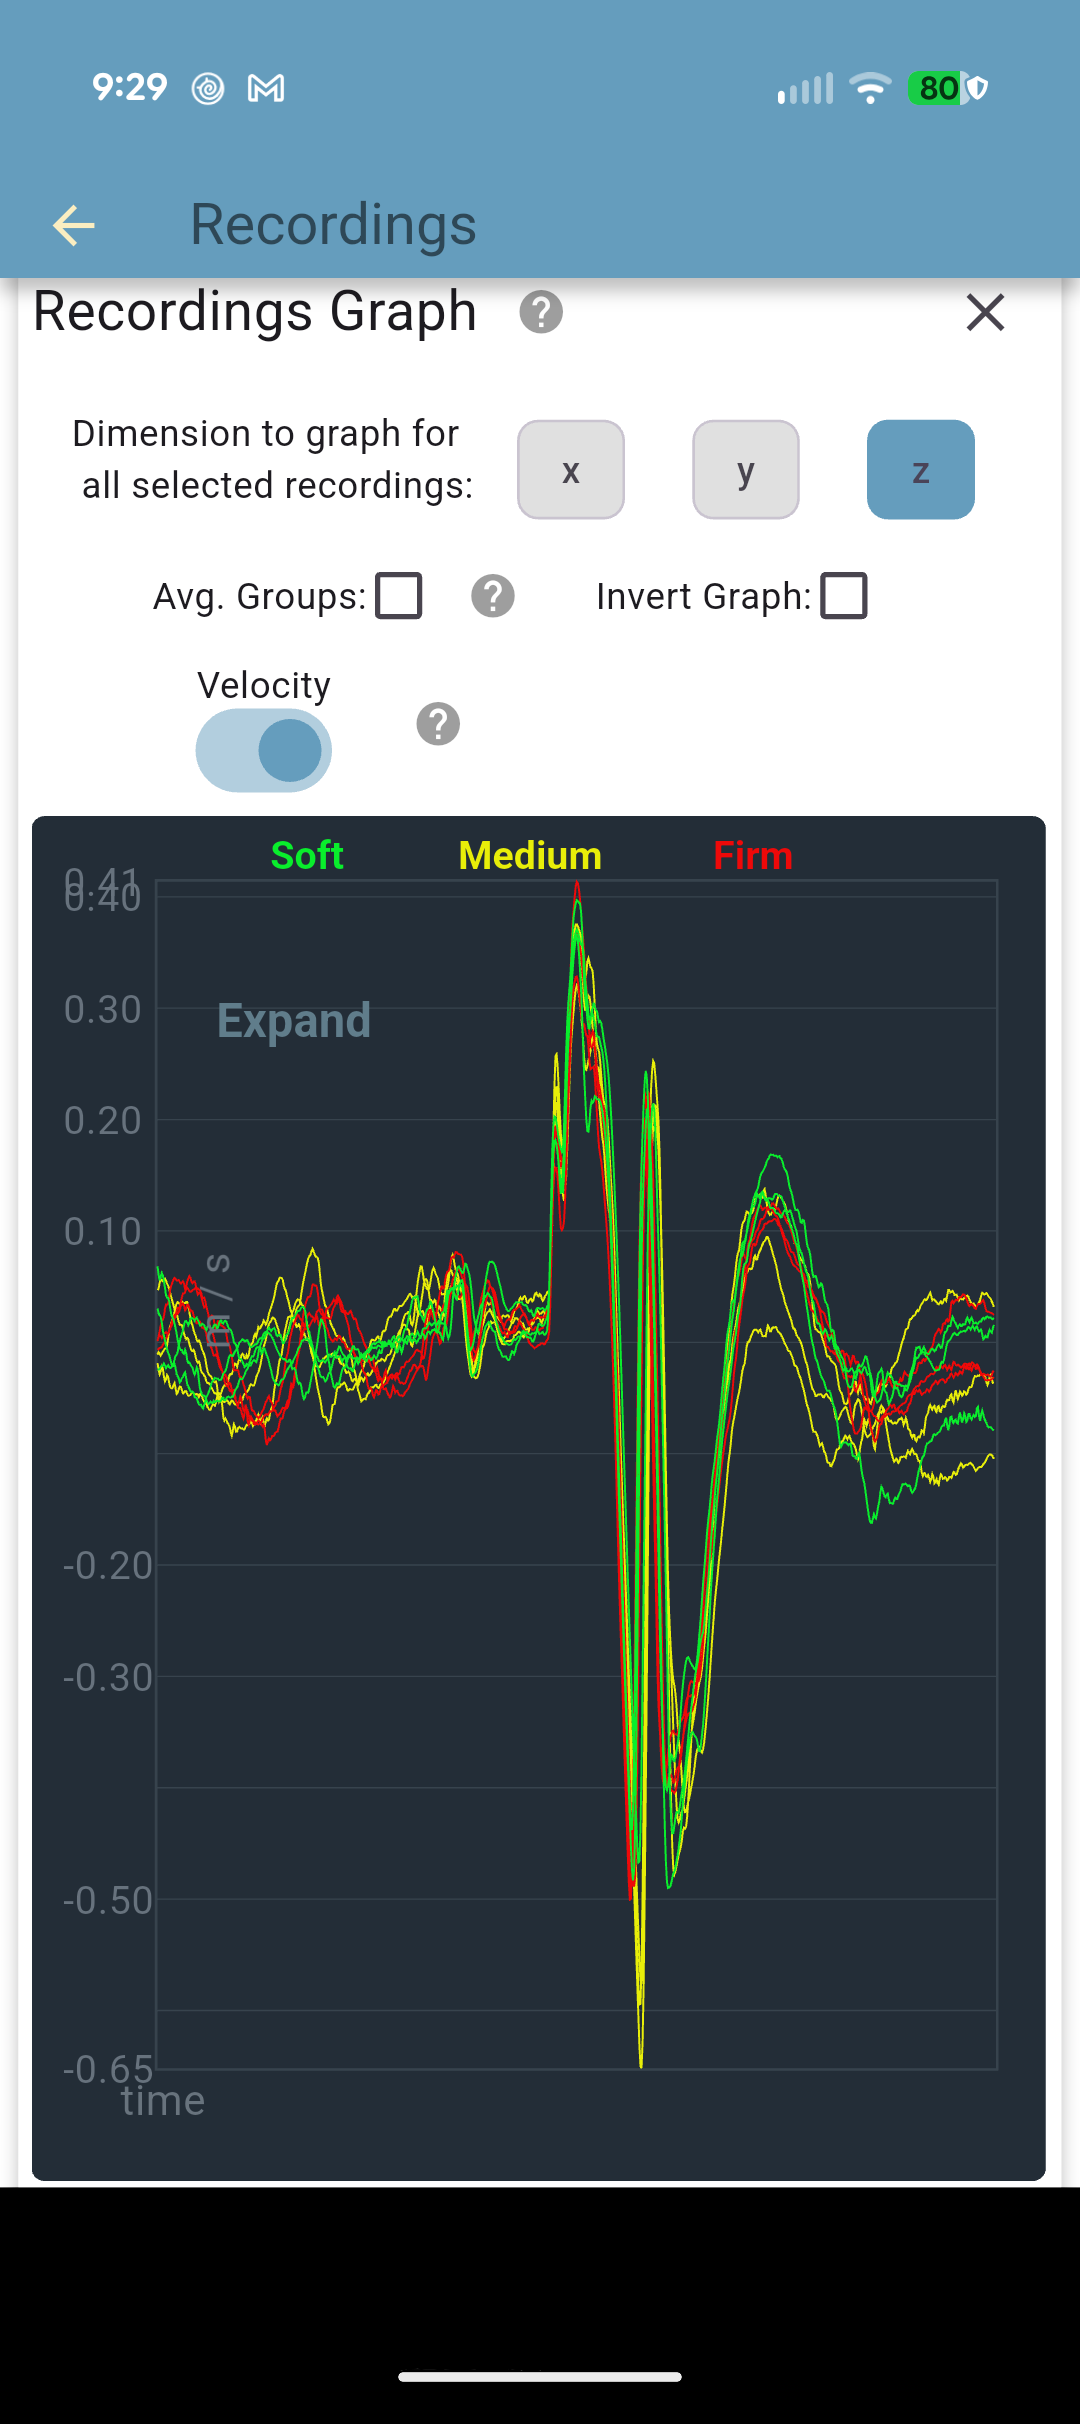
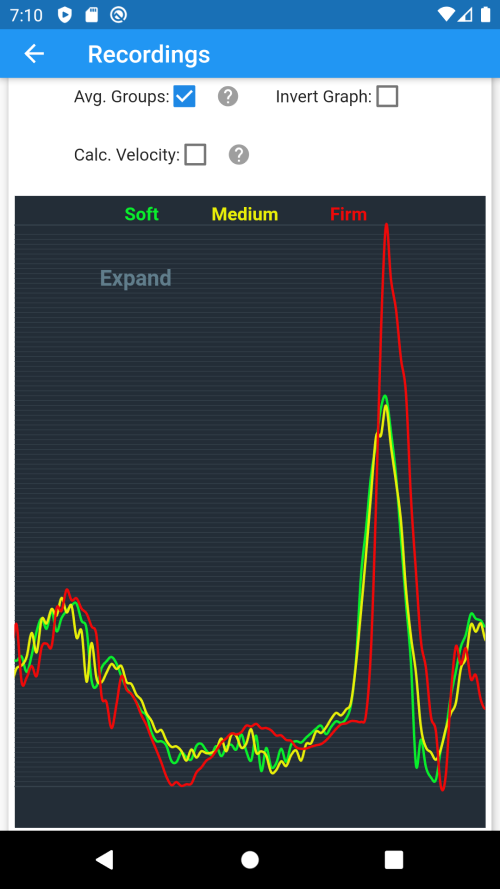
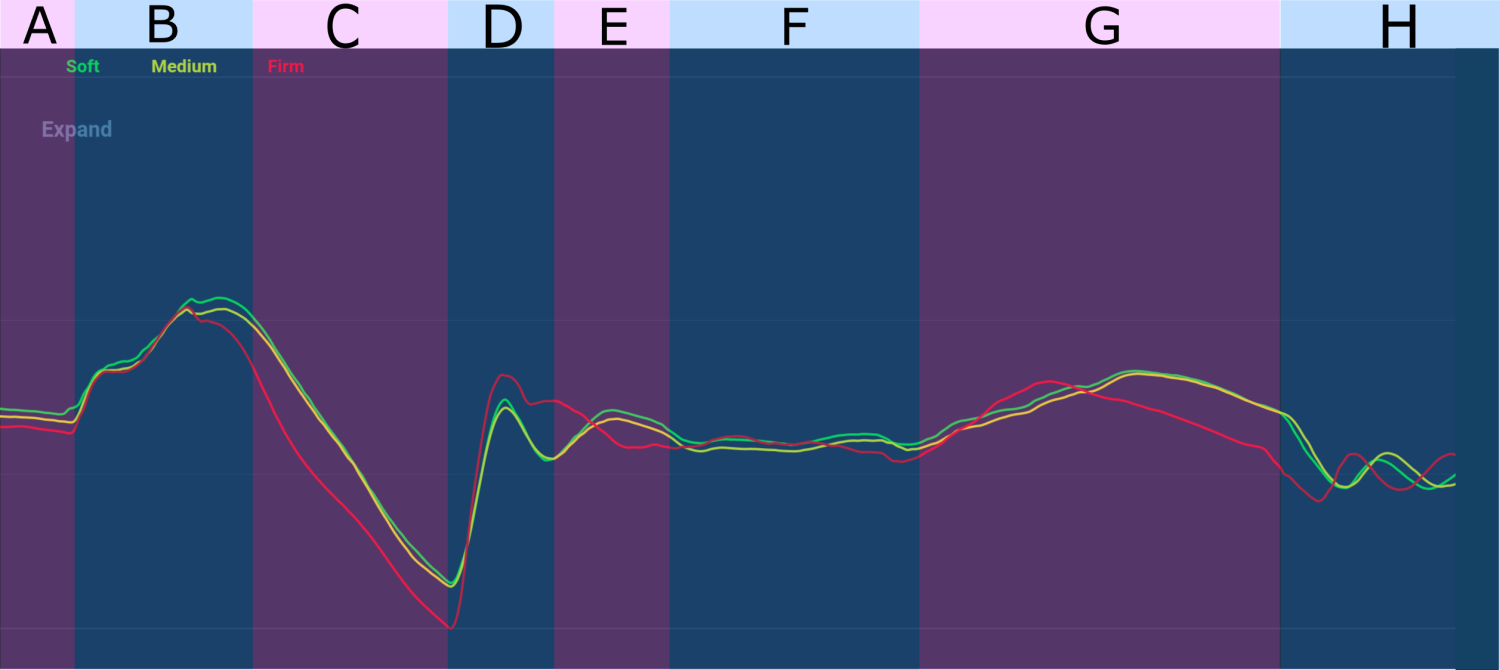
Collapse colored lines into a single average per setting to make differences clear. Or convert acceleration to velocity (m/s) to see the bike's actual motion over time — usually much easier to interpret than raw acceleration.
The video below is synced to a yellow tracking line on the graph. As the video plays, the line walks across the trace so you can see exactly which part of the curve corresponds to each phase of the bump impact. Toggle between Acceleration and Velocity to see both views of the same data.
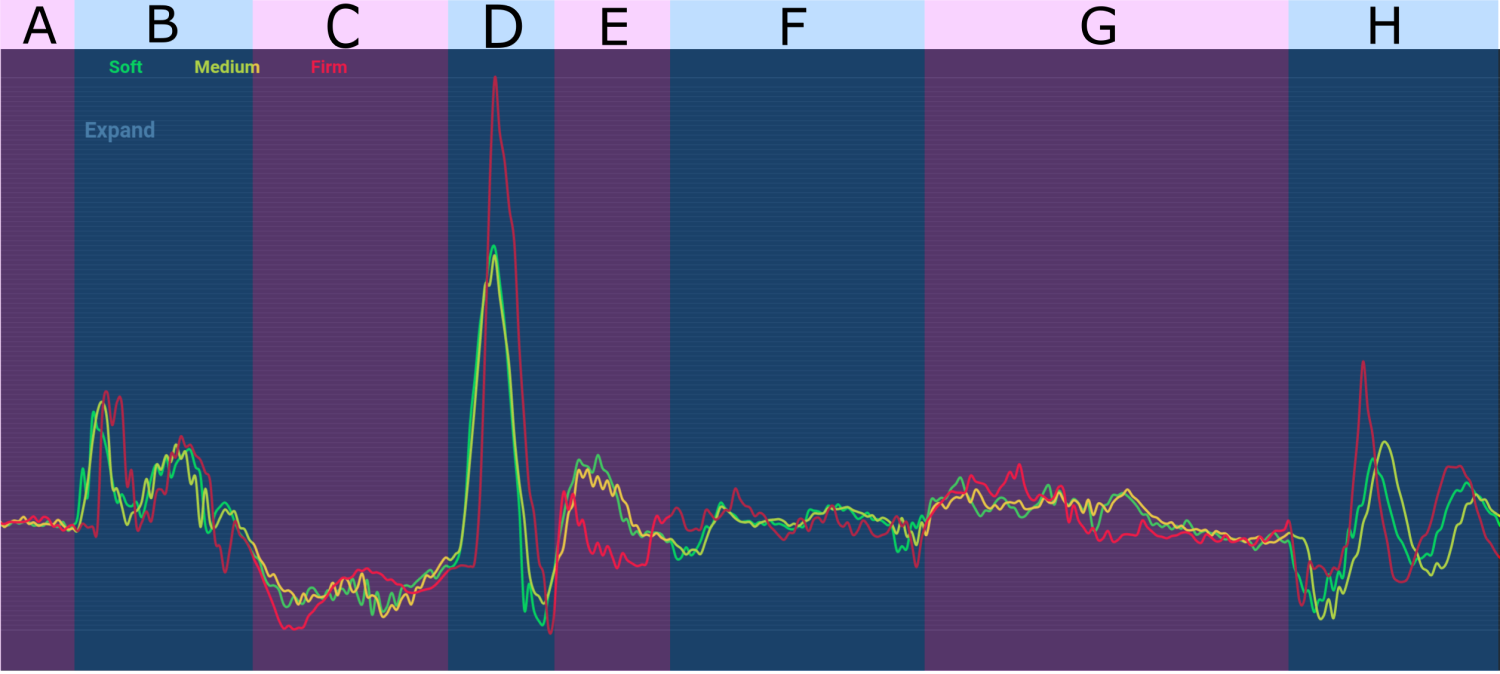
Below is a summary of what's happening in each section of the graphs above. All recordings were captured with the phone mounted horizontally on the front handlebars, screen up, targeting the front suspension. The Z axis is graphed because we care about vertical acceleration (up/down). Each line is the average of two recordings at those settings — the pairs match closely, indicating minimal rider/environment noise.
The bike approaches the bump on flat ground at constant velocity. As expected, both the Acceleration and Velocity graphs show little variation during this section.
The front tire makes initial contact with the bump, causing sharp upward acceleration. The first spike comes from the tire rolling over the bump — lifting the bike and compressing the front suspension. The smaller second spike is the suspension rebounding from that initial impact, pushing the bike upward. The Velocity graph mirrors this: upward velocity ramps sharply, flattens briefly, then climbs again as the suspension pushes back.
After clearing the bump, upward acceleration reverses into a negative force as the bike falls. This is where rebound settings matter most. The Firm rebound (red) drops the bike with greater negative acceleration — a less firm rebound would let the wheel extend back toward the ground faster, restoring contact with the back edge of the bump and the ground sooner, supporting the bike/rider weight earlier. The Firm line is a clear example of poor wheel ground-tracking. Same story in Velocity: the firm setting falls faster with higher downward velocity than soft or medium. Section C tells you the Firm setting is too firm for these conditions.
The front tire and front suspension are now loaded with the bike/rider weight. Sharp upward acceleration as the ground and the suspension push back against the falling mass.
Some oscillation as the bike recovers from Section D's spike. Counter-intuitively, the Firm rebound rebounds with higher velocity here than the lighter settings — likely because the firmer setting drove the bike to the ground with more force in C/D, so it has more energy to push back. But the Firm setting does damp the oscillation faster than the others (most visible on the Velocity graph). It buys you less oscillation at the cost of much higher acceleration spikes — a trade-off most riders would lose, since high vertical force loss tends to mean the front tire's grip on the ground is variable. (Vorsprung Suspension's two-part YouTube video on grip is worth watching.)
The bike has stabilized from the front impact. Minimal change in acceleration or velocity as the bump passes between the front and rear wheels.
The rear tire makes initial contact with the bump, lifting the front of the bike gently upward. Most apparent on the Velocity graph.
Moderate oscillation visible in both graphs — likely from the rear suspension recovering, not the front.
Tuning by feel works up to a point. Tuning by data tells you exactly when a rebound setting is too firm — when the bike loses ground tracking, when oscillation starts, when the suspension is fighting you instead of working for you. ShockTune turns "this feels off" into "the trace shows extra negative-Z velocity in the rebound phase."